Restaurant floor plan covers worksheet
- Covers the plan seats in one service
- 66
- Computed on this page from the inputs below
- Seats on the floor plan
- 46
- Computed on this page from the inputs below
- Tables the book has to allocate
- 14
- Computed on this page from the inputs below
- Sittings one table turns in a service
- 2.0
- Computed on this page from the inputs below
Every figure the worksheet returns is worked from the figures you enter. Where this site names an occupancy rule or a definition it comes from a public document, cited under the tool it appears in, and nothing here is advice about whether your own room is safe or lawful to fill to a given number.
Email me this result
We will send you these figures and a link back to them. One email, nothing else unless you tick the box.
The figures below are a worked example from a 14 table dining room: 66. Change any of them for your own room.
Download the Restaurant floor plan covers worksheet worked example (CSV)
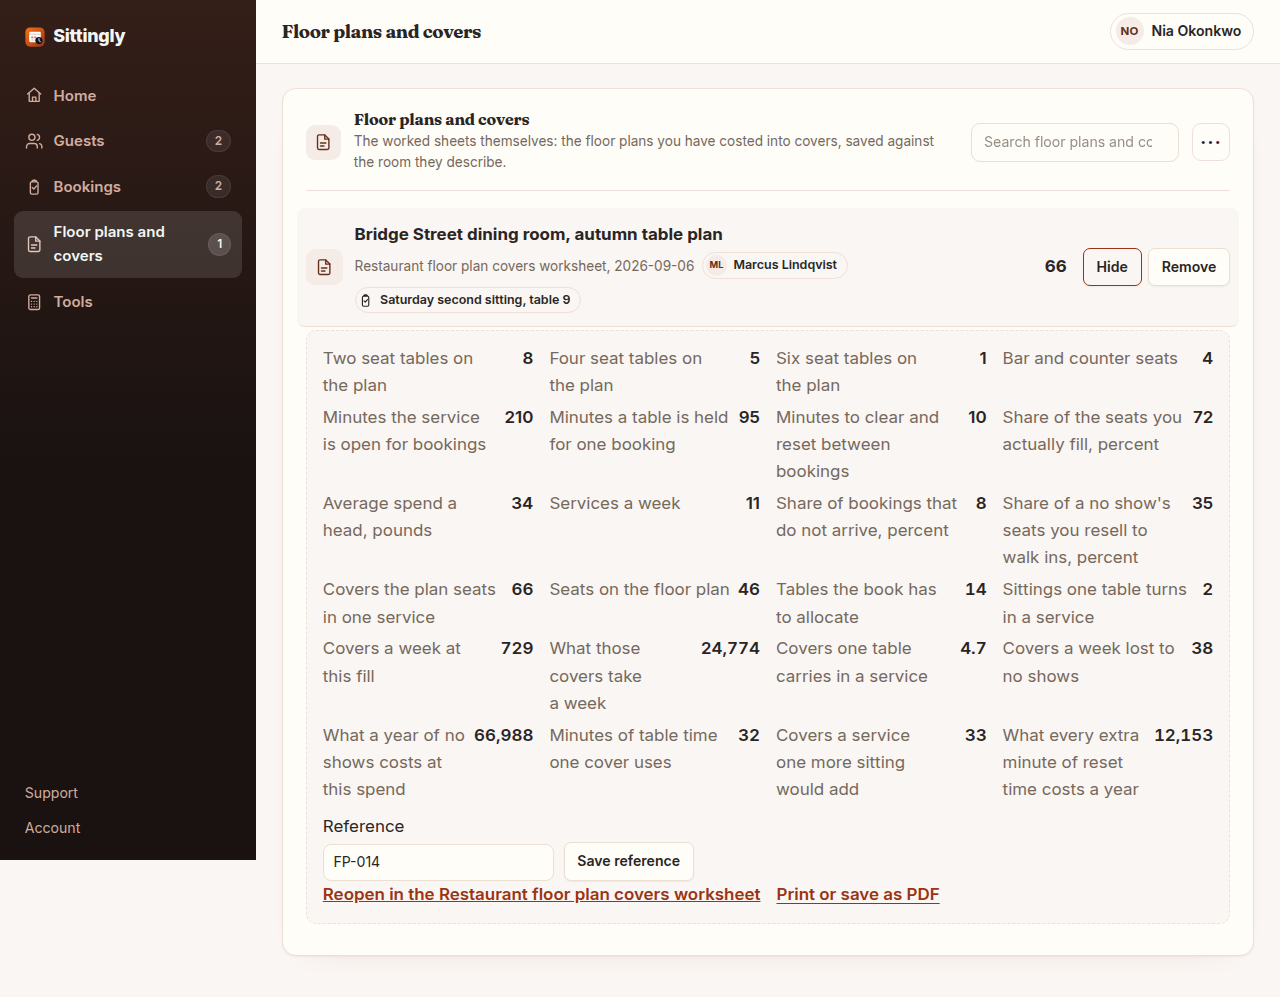
The floor plan covers worksheet turns a table plan into the two numbers a booking book is actually run on. You give it your own table mix, the bar and counter seats that take a booking, how long the service is open for bookings, how long a table is held for one party and how long it takes to clear and reset it, the share of seats you really fill, what a head spends, how many services you run a week, and the share of bookings that do not arrive. It returns the covers the plan seats in one service, the sittings one table turns, the covers and the money a week, what a year of no shows costs you at your own recovery rate, and the one figure nobody works out: what a single extra minute of reset time costs across a year.
Where the constants in this tool come from
Approved Document B (fire safety) volume 2: buildings other than dwellings, Table D1 Floor space factors. The published occupancy factors this worksheet is deliberately not: 1.0 m2 per person for a restaurant or dining room against 0.3 for bar areas within 2m of a serving point. Those are design figures for escape provision. The worksheet works the covers your own table plan seats at your own turn times, which is a smaller and more useful number, and the two should never be confused.
What operators ask about the Restaurant floor plan covers worksheet
Which figures do I need before using the floor plan covers worksheet? Your own table mix counted off the plan rather than off a capacity somebody quoted you, the minutes you hold a table for a booking, the minutes it takes to clear and reset it, roughly what share of the seats you fill on an average service, your average spend a head, and how many bookings do not arrive. Nothing comes from outside your own restaurant.
Why does it ask how much of the room I actually fill? Because a four seat table taking a party of two is the single largest gap between what a room seats and what it takes, and it is the number that makes every capacity claim in this trade optimistic. Putting it in as an honest percentage is what stops the worksheet returning a covers figure you will never hit.
Is the covers figure the same as my legal capacity? No. This is what your table plan seats at your own turn times, which is an operational number. The occupancy a building is designed for is a separate calculation using floor space factors, and what your premises may lawfully hold is decided by your fire risk assessment and the authority that enforces it, not by a worksheet.